




OEE (Overall Equipment Effectiveness) shows how much of a machine’s planned production time becomes fully productive time. The formula is simple: Availability × Performance × Quality. Yet the same machine, the same shift, and the same production data can produce different OEE values, because the result depends on which time is classified as planned downtime and where the ideal cycle time comes from.
This guide defines the OEE components using the ISO 22400-2 time base, works through a step-by-step numerical example, and explains the common definition errors. The goal is not to produce one “correct” percentage; it is to make the same data readable in a consistent, auditable, and comparable way.
OEE at a Glance
| Core Formula | OEE = A × P × Q |
|---|---|
| Time Base | Calendar time → planned downtime → planned production time → availability losses → operating time → performance losses → net operating time → quality losses → fully productive time |
| Related Standards | ISO 22400-2 (manufacturing KPI definitions); Nakajima (1988) in the TPM literature; SEMI E10 and VDI 3423 cover separate scopes and are not general OEE standards. |
| Data Source | PLC/CNC state signal, PartCount, spindle load, MTConnect/FOCAS/OPC UA tags; ideal cycle and scrap data come from separate systems. |
| Critical Decision | Which bucket setup, tool changes, and material waiting go into. If that definition is not written down, OEE is not comparable. |
| What It Is For | Finding the loss source on one machine or cell, choosing an improvement priority, and tracking change over time. It is not a cross-industry ranking tool. |
What OEE Is and Is Not
OEE measures how much of a production asset’s planned production time is converted into fully productive time. Three components are multiplied:[1][2]
- Availability (A): The share of planned production time in which the machine can run. Breakdowns, setup, tool changes, and material waiting reduce it.
- Performance (P): How fast the machine produces relative to the ideal cycle time. Slowdowns, micro-stops, and air cutting affect it.
- Quality (Q): The share of parts that are good on the first pass. Scrap and rework reduce it.
OEE has its roots in the TPM literature; Nakajima’s 1988 work placed OEE at the center of TPM. ISO 22400-2 provides common definitions for OEE and other manufacturing KPIs. ISO 22400-2 is a KPI definition standard; it does not by itself specify the data source, sampling rate, or ideal cycle time. “ISO-aligned OEE” therefore means the definitions are documented and consistent with the standard; it does not mean the result equals an industry average.[1][2]
The Time Base: Which Duration Goes Where?
The most contested part of OEE is not the formula but the time base. The table below shows a time split consistent with ISO 22400-2 KPI definitions. Companies may combine some buckets for their own operations, but they should write the definition down and keep it stable across periods:[1]
| Time Bucket | Definition | Place in OEE |
|---|---|---|
| Calendar time | The 168 hours in a week, including time when the plant is closed. | Outside OEE; the denominator of TEEP. |
| Planned downtime | A deliberate decision not to produce: holidays, no shift, meal/tea breaks. | Subtracted from calendar time. |
| Planned production time | Calendar time − planned downtime. | Denominator of availability. |
| Availability loss | Breakdowns, setup, tool changes, material/crane waiting, unplanned breaks. | Reduces A; setup is included. |
| Operating time | Planned production time − availability losses. | Denominator of performance. |
| Performance loss | Slowdowns, micro-stops, air cutting, deviation from ideal cycle. | Reduces P. |
| Net operating time | Operating time × performance ratio; theoretical production time. | Denominator of quality. |
| Quality loss | Scrap, rework, startup scrap. | Reduces Q. |
| Fully productive time | Good parts × ideal cycle time. | Numerator of OEE. |
Is setup planned downtime? For OEE, usually not: setup is availability loss because the machine is not cutting. Breaks and holidays are a deliberate decision not to produce and are treated as planned downtime. Some companies classify setup as planned and exclude it from OEE. That is a definition change; the process has not improved, but the score rises. Whichever convention you use, state it below the report and verify that another site uses the same convention before comparing. ISO 22400-2 provides common KPI definitions; a site-specific time contract is still required.[1][3]
Step-by-Step OEE Calculation
The following example is illustrative; it is not data from a real plant. Consider a five-axis CNC machining center running a 24-hour day:
- Calendar time: 1,440 minutes
- Meal and tea breaks: 60 minutes (planned downtime)
- Setup and fixture change: 150 minutes
- Unplanned breakdowns and tool breakage: 90 minutes
- Material/crane waiting: 30 minutes
- Parts produced: 420
- Ideal cycle time: 2.1 minutes/part
- Scrap: 18 parts
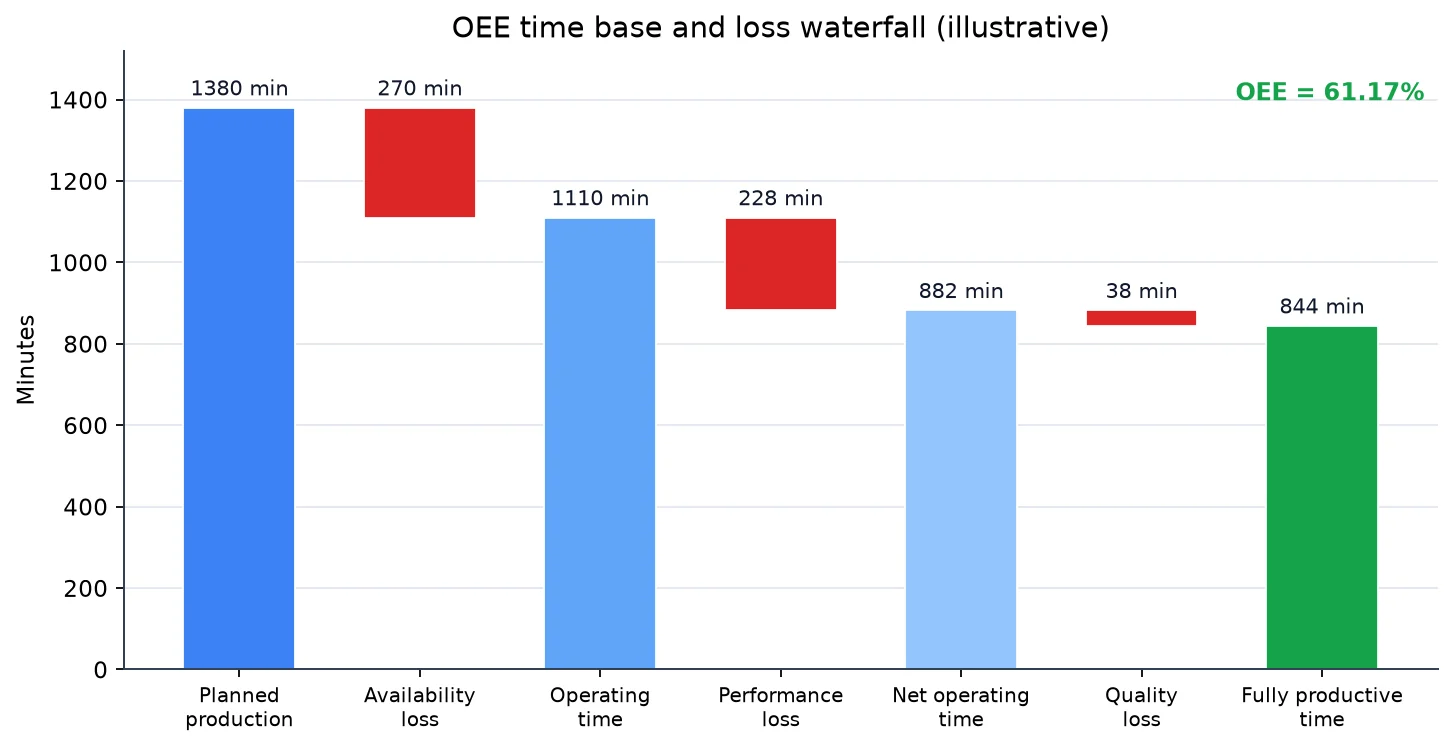
1. Planned production time: 1,440 − 60 = 1,380 minutes.
2. Availability losses: 150 setup + 90 breakdown + 30 waiting = 270 minutes.
3. Operating time: 1,380 − 270 = 1,110 minutes.
4. Availability: 1,110 / 1,380 = 80.43%.
5. Performance: (420 × 2.1) / 1,110 = 882 / 1,110 = 79.46%.
6. Quality: (420 − 18) / 420 = 402 / 420 = 95.71%.
7. OEE: 0.8043 × 0.7946 × 0.9571 = 61.17%.
Now calculate the same data with setup treated as planned downtime. Planned production time becomes 1,440 − 60 − 150 = 1,230 minutes; operating time remains 1,110 minutes. Availability becomes 1,110 / 1,230 = 90.24%, and OEE becomes 0.9024 × 0.7946 × 0.9571 = 68.63%. Nothing physical has changed; only the 150 minutes of setup have been removed from the denominator. In this example the difference is about 7.5 points. A general “15–20 points” rule of thumb is not reliable; the effect depends on setup time as a share of planned production time.[1][3]
In this example, the most effective way to improve OEE is not to push performance but to reduce the 270 minutes of availability loss. However, shortening setup does not automatically raise OEE: if the recovered time is not used to produce additional parts in the same shift, the performance denominator grows and OEE may not change. The effect depends on how the extra capacity is used and on the part count.
Six Big Losses and Their CNC Counterparts
The six big losses from the TPM literature map to OEE components as follows:[2][4][6]
| Loss | Typical CNC Counterpart | Component | Measurement Signal |
|---|---|---|---|
| 1. Unplanned breakdown | Spindle bearing, servo alarm, hydraulic failure. | A | Alarm code, red tower light. |
| 2. Setup and adjustment | Die/fixture change, WCS reset, tool offsets. | A | Door open, program stop, operator label. |
| 3. Idling and minor stops | Chip cleaning, coolant level, ATC indexing. | P | Short stops; requires sub-second sampling. |
| 4. Reduced speed | Feed override reduction, slowdown due to chatter. | P | Override value, axis speed, spindle load. |
| 5. Startup scrap | First parts before thermal stability, offset error. | Q | Scrap/reject record, CMM measurement. |
| 6. Production defects | Tool wear, breakage, workpiece slip. | Q | Scrap/rework record, measurement. |
Three Common Definition Errors
1. Treating setup as planned downtime and removing it from OEE
Setup is time when the machine is not cutting. Keeping it as an availability loss makes SMED and pre-setup improvements visible. Treating setup as planned downtime raises the score without improving the process. If you use that convention, state it below the report and do not compare it with other sites.[4]
2. Using the ERP standard time as the ideal cycle time
ERP standard times may include work-study allowances, historical averages, and fatigue factors. If that time is longer than the true ideal cycle, performance rises above 100% and software usually clamps it to 100%. Clamping hides both the excess and the real losses. The ideal cycle should be a demonstrated best cycle on the machine, not an ERP assumption.[3]
3. Using the CAM simulation time as the ideal cycle time
CAM simulation may not fully represent tool changes, door opening, part loading, and the controller’s acceleration ramps. If the simulated time is shorter than the physical machine, performance looks low and the operator is blamed unfairly. The ideal cycle should be validated on the machine, not in the CAM window.
The Limits of OEE
- It is not a quality capability metric: Q shows good/scrap ratio, not tolerance capability or Cpk.
- It is not a financial performance metric: High OEE on a low-demand machine can build inventory rather than profit.
- It is not a cross-industry benchmark: Part mix, setup frequency, material, and tolerances differ; OEE values are not directly comparable.
- It is not a root-cause tool: It shows which component is weak, not why. Root cause requires downtime, sensor, and operator data.
- It is not TEEP: TEEP is OEE multiplied by the loading rate; it shows capacity utilization, not a stand-alone investment case.
Reading the Components Together
A single OEE percentage does not show which component is the problem. The same OEE can be reached through very different paths, so A, P, and Q must be read separately:
- High A, low P: The machine is almost always available but runs slowly. Check feed override, tool wear, unnecessary waits in the NC program, and servo settings.
- High P, low Q: The machine produces fast but scrap is high. Check fixture rigidity, tool geometry, material hardness variation, and first-piece setup.
- High Q, low A: Quality is good but the machine stops often. Setup, breakdowns, and material waiting come to the fore; increasing speed will not fix this picture.
The dashboard should show A/P/Q and the minutes lost in each component, not only the composite OEE. The improvement team should focus on the largest loss; pushing all three components at once often improves one at the expense of another.
What OEE Target?
There is no universal OEE target. Nakajima’s 1988 reference of 90% availability, 95% performance, and 99% quality is a benchmark for high-volume, low-mix TPM environments, not a binding threshold for every CNC shop. In a high-mix, low-volume contract shop, setup frequency and part complexity naturally limit OEE.[2]
A more useful approach is to set a baseline for a machine or part family and track change over time. Ranking machines with different part mixes, tolerances, and materials produces misdirection, not improvement. The OEE target should be defined within the same product family and a similar setup profile.
From CNC Data to OEE
OEE accuracy depends on the accuracy of timestamps and part counts. Reading Execution, PartCount, and spindle load from the CNC controller through FOCAS, LSV2, OPC UA, or MTConnect is more reliable than manual forms, but it is not sufficient on its own. Execution=ACTIVE may include air cutting, so it must be interpreted together with spindle load and part count. Time synchronization, data quality, and a tag dictionary must be handled separately.[5]
To capture micro-stops, the sampling period should be shorter than one second; a five-minute poll cannot see a two-minute chip-cleaning stop. Not every signal needs the same rate: state signals can run at 1 Hz, spindle load at 10 Hz, and high-frequency vibration on a separate DAQ at 10–50 kHz.
Decision Matrix: Putting Events in the Right Bucket
| Event | OEE Bucket | Note |
|---|---|---|
| Setup / fixture change | Availability loss | If treated as planned, state it in the report. |
| Meal/tea break | Planned downtime | Outside OEE; stays in calendar time for TEEP. |
| Tool breakage / breakdown | Availability loss | Match with the maintenance record. |
| Override at 80% | Performance loss | Record why it was reduced. |
| Short chip cleaning (<3 min) | Micro-stop / performance | Sampling interval must be short enough. |
| Waiting for first-piece CMM approval | Availability loss | Quality control is not planned process time. |
| Scrap / rework | Quality loss | Track separately from the part count. |
Six Steps to Set Up OEE
- Write the time contract: Production, maintenance, and finance agree on planned downtime, setup, breaks, and waiting definitions. The definition is visible below the report.
- Take data from the controller: Replace manual forms; collect
Execution,PartCount, and spindle load through FOCAS/LSV2/MTConnect. - Validate the ideal cycle: Do not use the ERP standard or raw CAM time as-is; define the best cycle measured on the machine.
- Sample fast enough: 1 Hz or faster for state; below 1 s for micro-stops. Keep high-frequency vibration separate.
- Show the components: The dashboard should display A/P/Q and lost minutes, not only OEE. Direct improvement to the weakest component.
- Validate weekly: Compare sensor data with operator labels; correct misclassification and missing part counts.
Conclusion: OEE Is a Diagnostic Tool
OEE is not a single “success percentage”; it is a diagnostic that shows where loss accumulates. Different OEE values from the same data indicate different definitions, not different formulas. Removing setup from the denominator raises the score but does not shorten setup; inflating the ideal cycle raises performance but does not speed up the machine.
Two questions should be asked: Which bucket contains setup and breaks, and is that definition written down? And is the ideal cycle in the performance calculation a time validated on the machine, or an ERP/CAM assumption? Without clear answers, the OEE number says more about the definition choice than about the process.
This guide is part of the CNC Data & Efficiency series. For the control layer, see the CNC Control Protocols guide; for the data model, see What Is MTConnect?.
References
- ISO 22400-2:2014 • Automation systems and integration — Key performance indicators (KPIs) for manufacturing operations management — Part 2: Definitions and descriptions • ISO OBP — 22400-2
- Seiichi Nakajima (1988) • Introduction to TPM: Total Productive Maintenance • Productivity Press • ISBN 0-915299-23-2
- Vorne Industries • The Fast Guide to OEE — Calculating OEE and the Six Big Losses • oee.com/calculating-oee
- Lean Enterprise Institute • Single-Minute Exchange of Die (SMED) • lean.org — SMED
- MTConnect Institute • MTConnect Standard and Model Browser — Controller Execution and PartCount • model.mtconnect.org
- Robert C. Hansen (2001) • Overall Equipment Effectiveness: A Powerful Production/Maintenance Tool for Increased Profits • Industrial Press • ISBN 0-8311-3138-1